Distill is a publication format for scientific and technical writing, native to the web. Learn more about using Distill for R Markdown at https://rstudio.github.io/distill. Much more text here ad libitem, etc, etc.
More text here… And then a link to chestradiologists.org.
The blue border around the image indicates it’s lightboxed.
Testing a right-floated image with wraparound text:
Vivamus venenatis egestas eros ut tempus. Vivamus id est nisi. Aliquam molestie erat et sollicitudin venenatis. In ac lacus at velit scelerisque mattis.
Vivamus venenatis egestas eros ut tempus. Vivamus id est nisi. Aliquam molestie erat et sollicitudin venenatis. In ac lacus at velit scelerisque mattis.
Vivamus venenatis egestas eros ut tempus. Vivamus id est nisi. Aliquam molestie erat et sollicitudin venenatis. In ac lacus at velit scelerisque mattis.
Vivamus venenatis egestas eros ut tempus. Vivamus id est nisi. Aliquam molestie erat et sollicitudin venenatis. In ac lacus at velit scelerisque mattis.
Testing a bordered Box
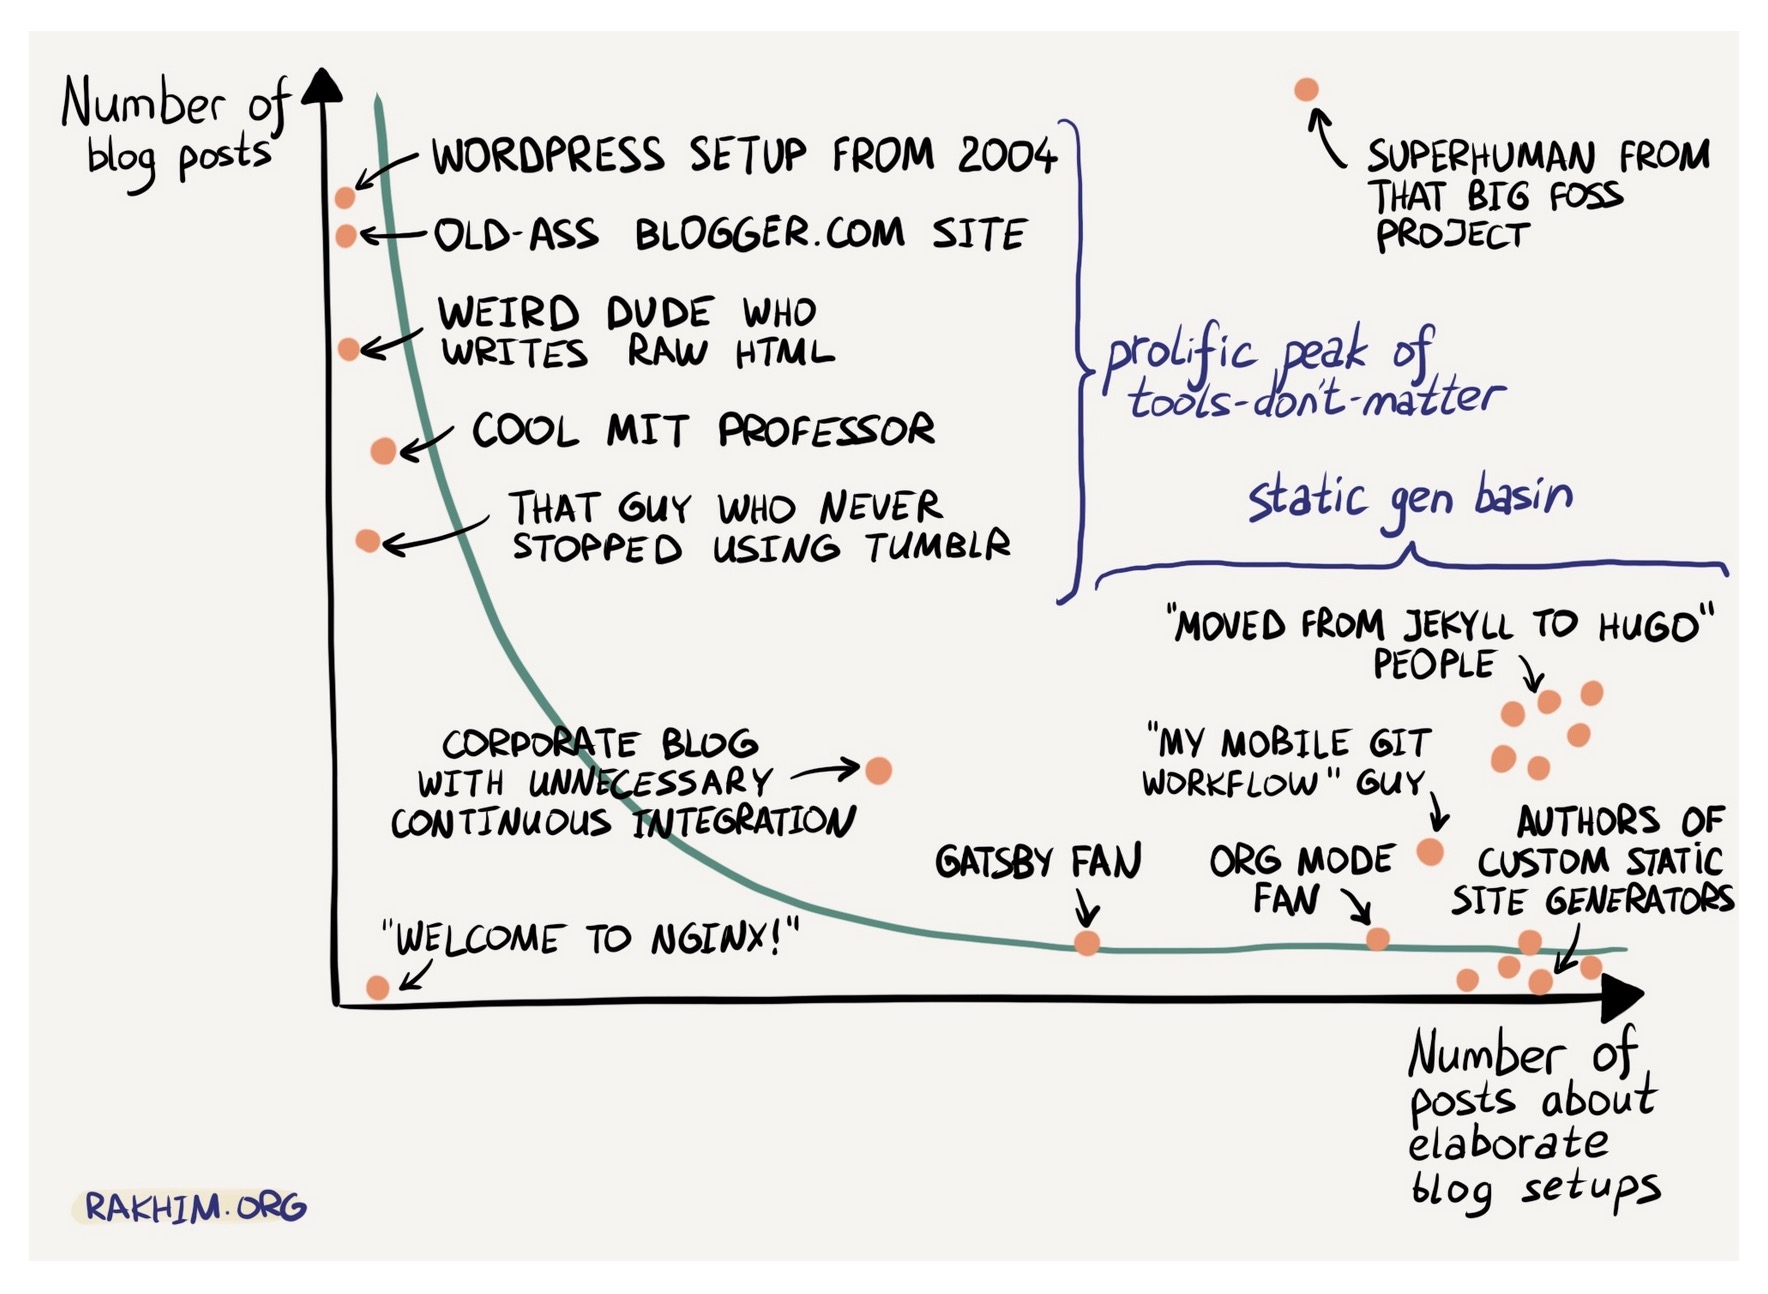
Testing inclusion of an outside web image, with attribution, but no lightbox function.

Figure 1: Figure from https://timogrossenbacher.ch/2016/12/beautiful-thematic-maps-with-ggplot2-only/
And another simpler way to do this for an external file with attribution:
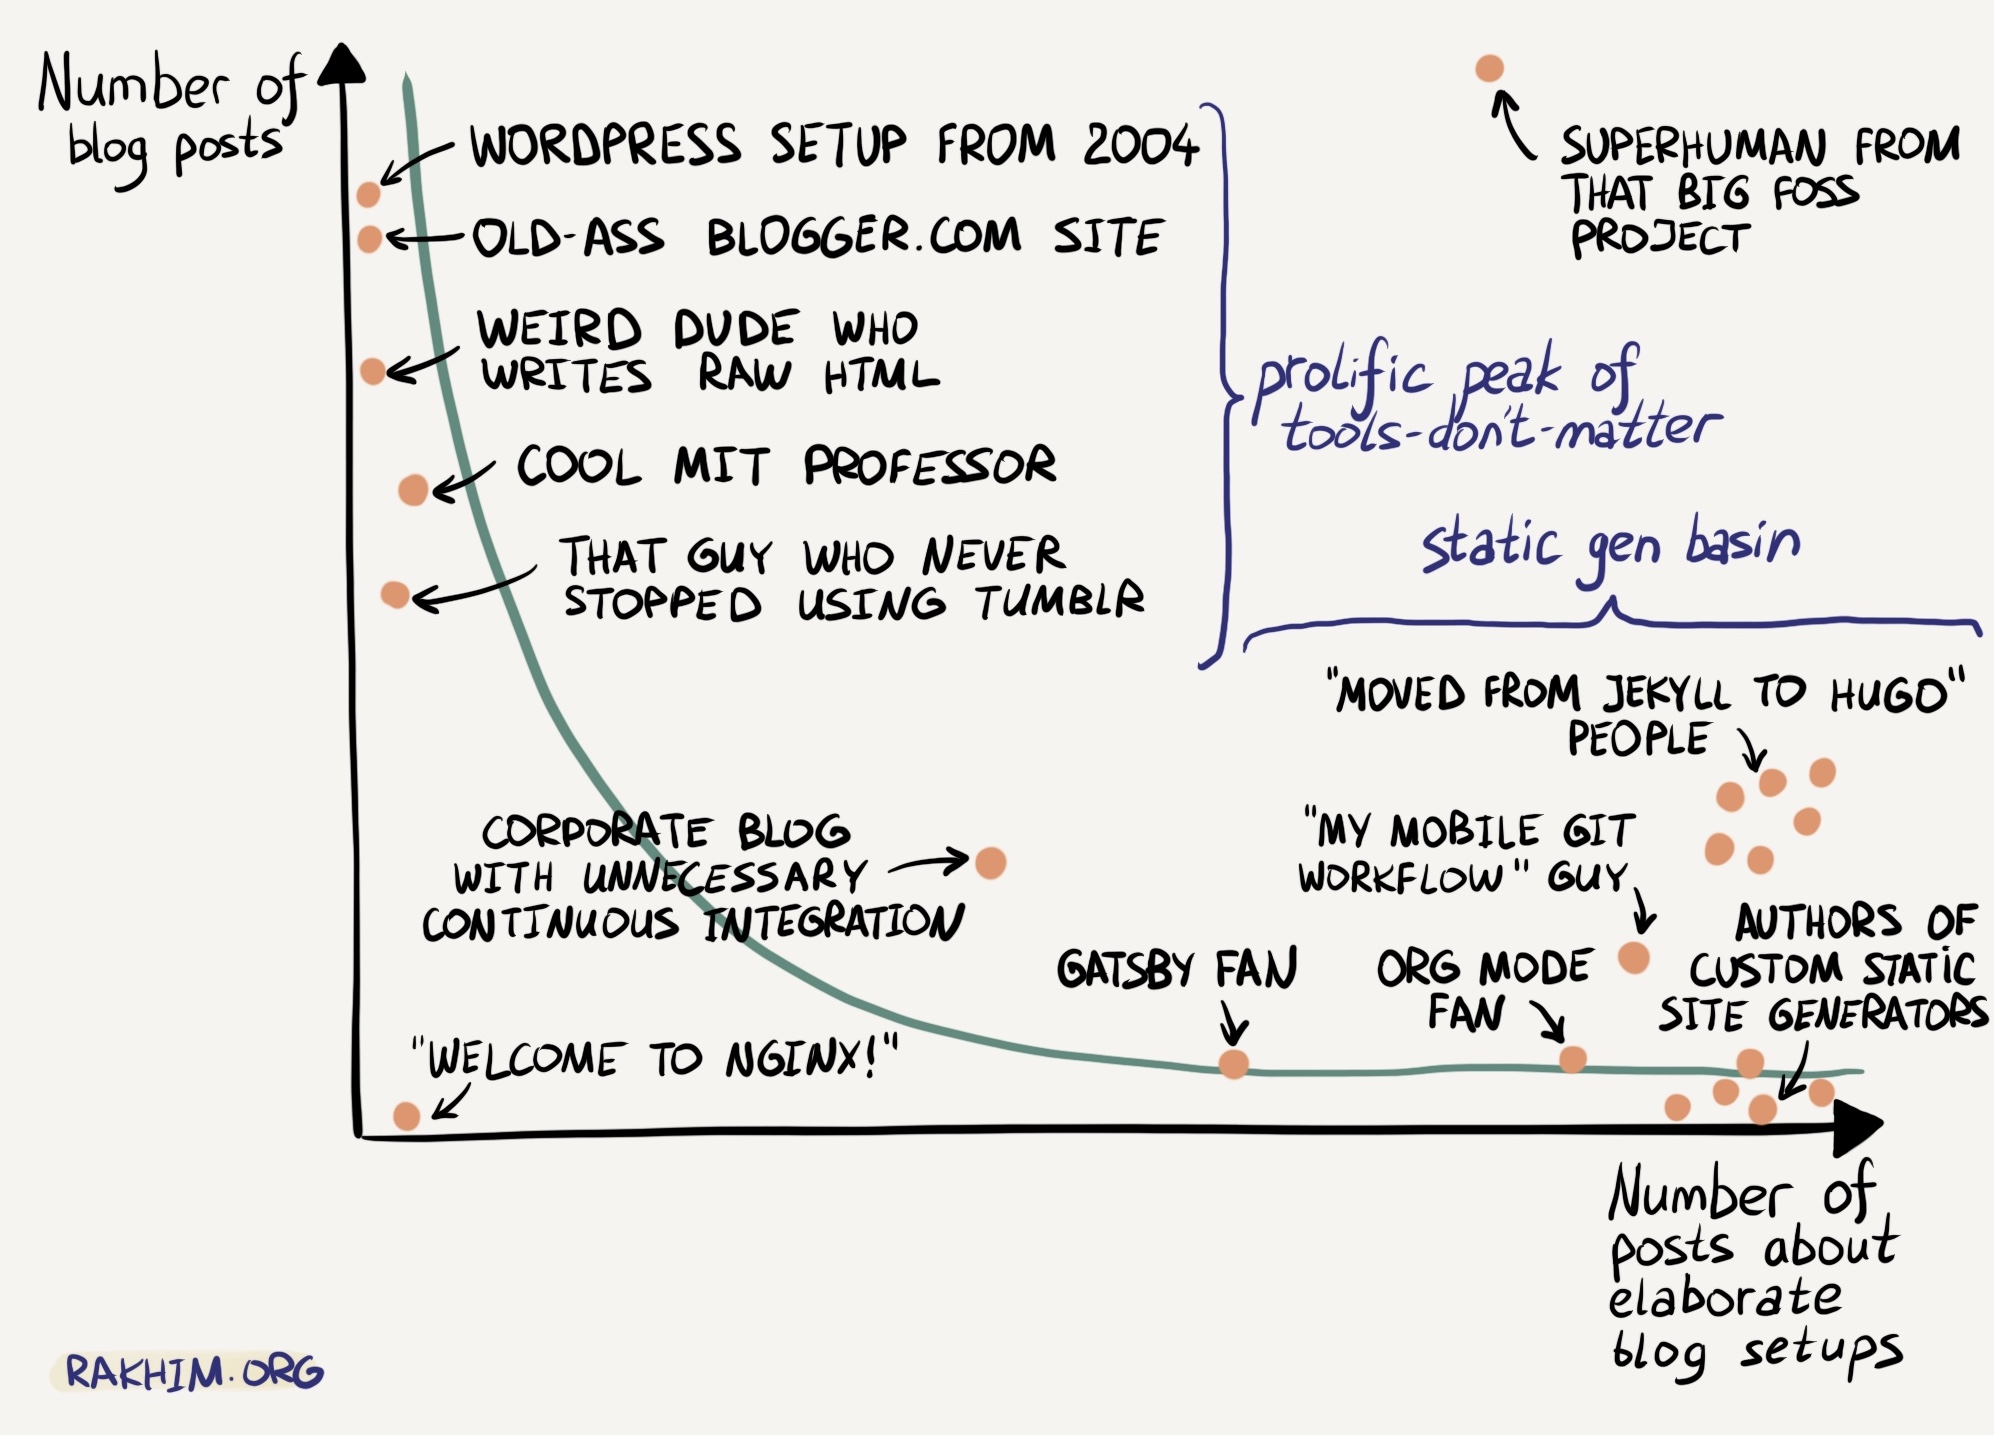
| Items | Features |
|---|---|
| Item 1 | Lorem ipsum dolor sit amet, consectetur adipiscing elit. Proin vehicula tempor ex. Morbi malesuada sagittis turpis, at venenatis nisl luctus a. |
| Item 2 | In eu urna at magna luctus rhoncus quis in nisl. Fusce in velit varius, posuere risus et, cursus augue. Duis eleifend aliquam ante, a aliquet ex tincidunt in. |
| Item 3 | Vivamus venenatis egestas eros ut tempus. Vivamus id est nisi. Aliquam molestie erat et sollicitudin venenatis. In ac lacus at velit scelerisque mattis. |
Definition lists
This is an example of creating a section of definitions with different formating:
- Aggregation
The process of collecting or gathering many separate pieces into a whole.
- Analytical skills in programming
Qualities and characteristics as well as computational tools associated with using facts to solve problems. E.g.,
R markdown, R packages, etc.
- Area chart
A data visualization that uses individual data points for a changing variable connected by a continuous line with a field in area underneath.
Testing two column grid
This is a css-derived alternative to a floating image for displaying an image with adjacent text.
Text here associated with the image alongside. ⟶
Suitable for explication text using colored arrows ⟶
Vivamus venenatis egestas eros ut tempus. Vivamus id est nisi. Aliquam molestie erat et sollicitudin venenatis. In ac lacus at velit scelerisque mattis ⟶
Inserting a horizontal line before and after a Teaching Points box.
Teaching Points
- This is my first teaching point
- This is my second teaching point
An example of a small table.
| A header here | A header for this |
|---|---|
| testing this | testing this too |
| confirm text | more text |
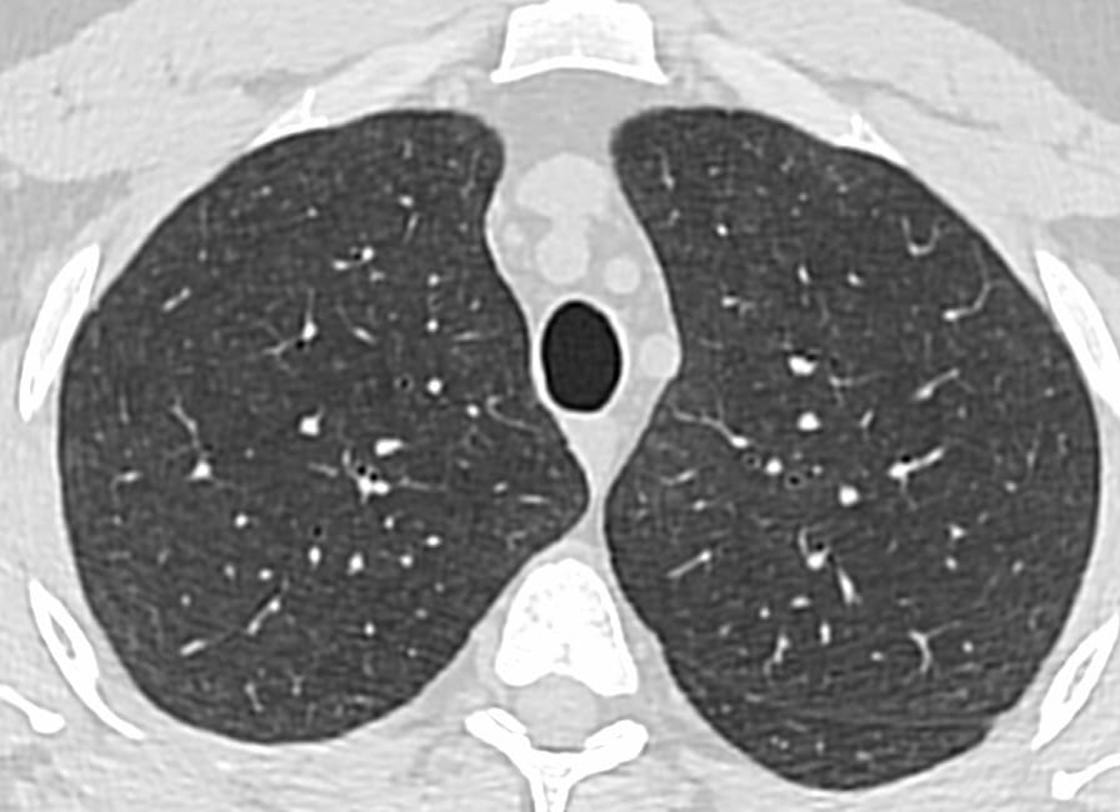
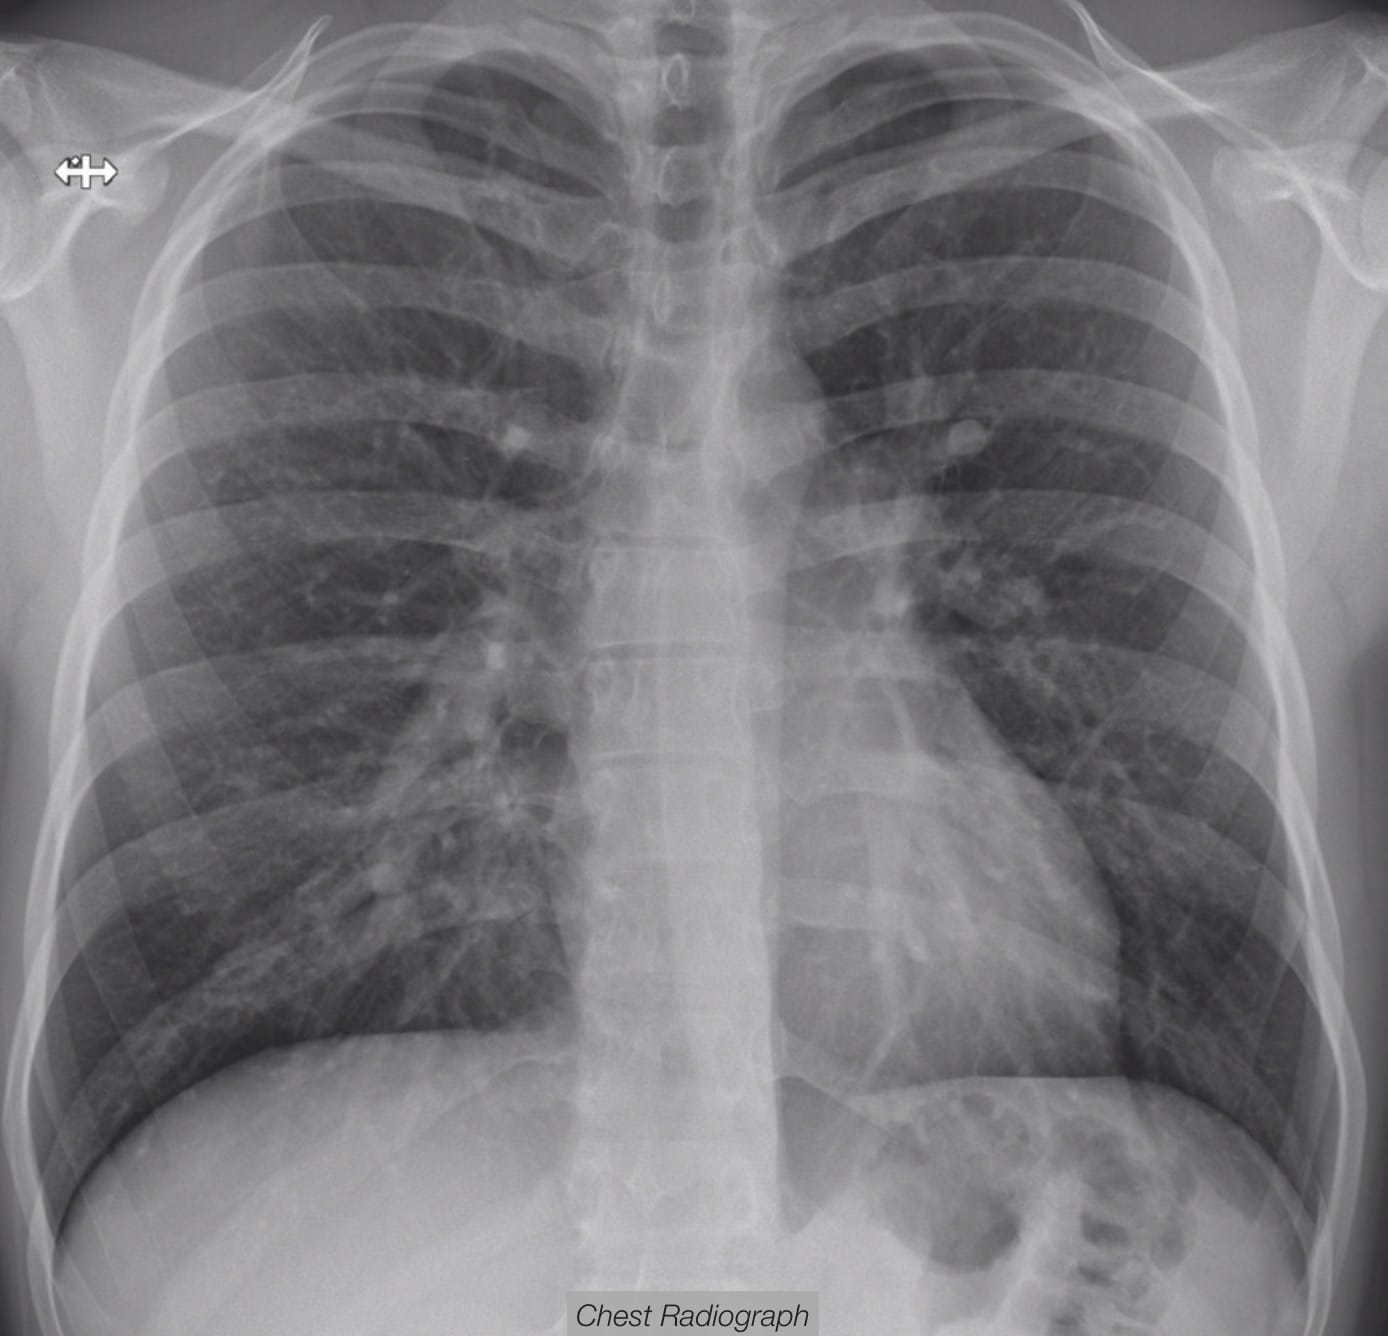
Chest Radiography
Here’s some text to see a hoverable footnote 1 of some kind.
Testing another kind of sidenote here. It contains a link to an article at pubmed.gov.
Radiography of Lung Edema
Chest Radiography
Here are several illustrative cases.
Hydrostatic Lung Edema
These are the pertinent findings:
This case is interesting for the following reasons:
- one reason
- second reason
End of Case
Acute Lung Injury Edema
Another image here.
Testing inline code:
Here is inline code for a declaration.
Blockquoting
Here is a quote from me
— Howard Mann
An approach to lung edema
| Cardiac (hydrostatic) edema | Hypervolemic (hydrostatic) edema | Acute lung injury edema | |
|---|---|---|---|
| Blood flow distribution | Inversion1 | Balanced | Normal |
| Interstitial edema | Yes | Yes | No or minimal |
1. If chronic pulmonary venous hypertension is present
Testing Pacsbin viewer
Here is text before presentation of the embedded viewer.
Let’s try a panelset with four Tabs:
Clinical Presentation
This will be the History and Clinical Presentation.
Images
Explanation of Findings
This will be the explanation of the findings and an explication.
Testing Pacsbin again…
Explanation II Three Columns
Text here associated with the image alongside. ⟶
Suitable for explication text using colored arrows ⟶
O.K.
Sweet! It works!!
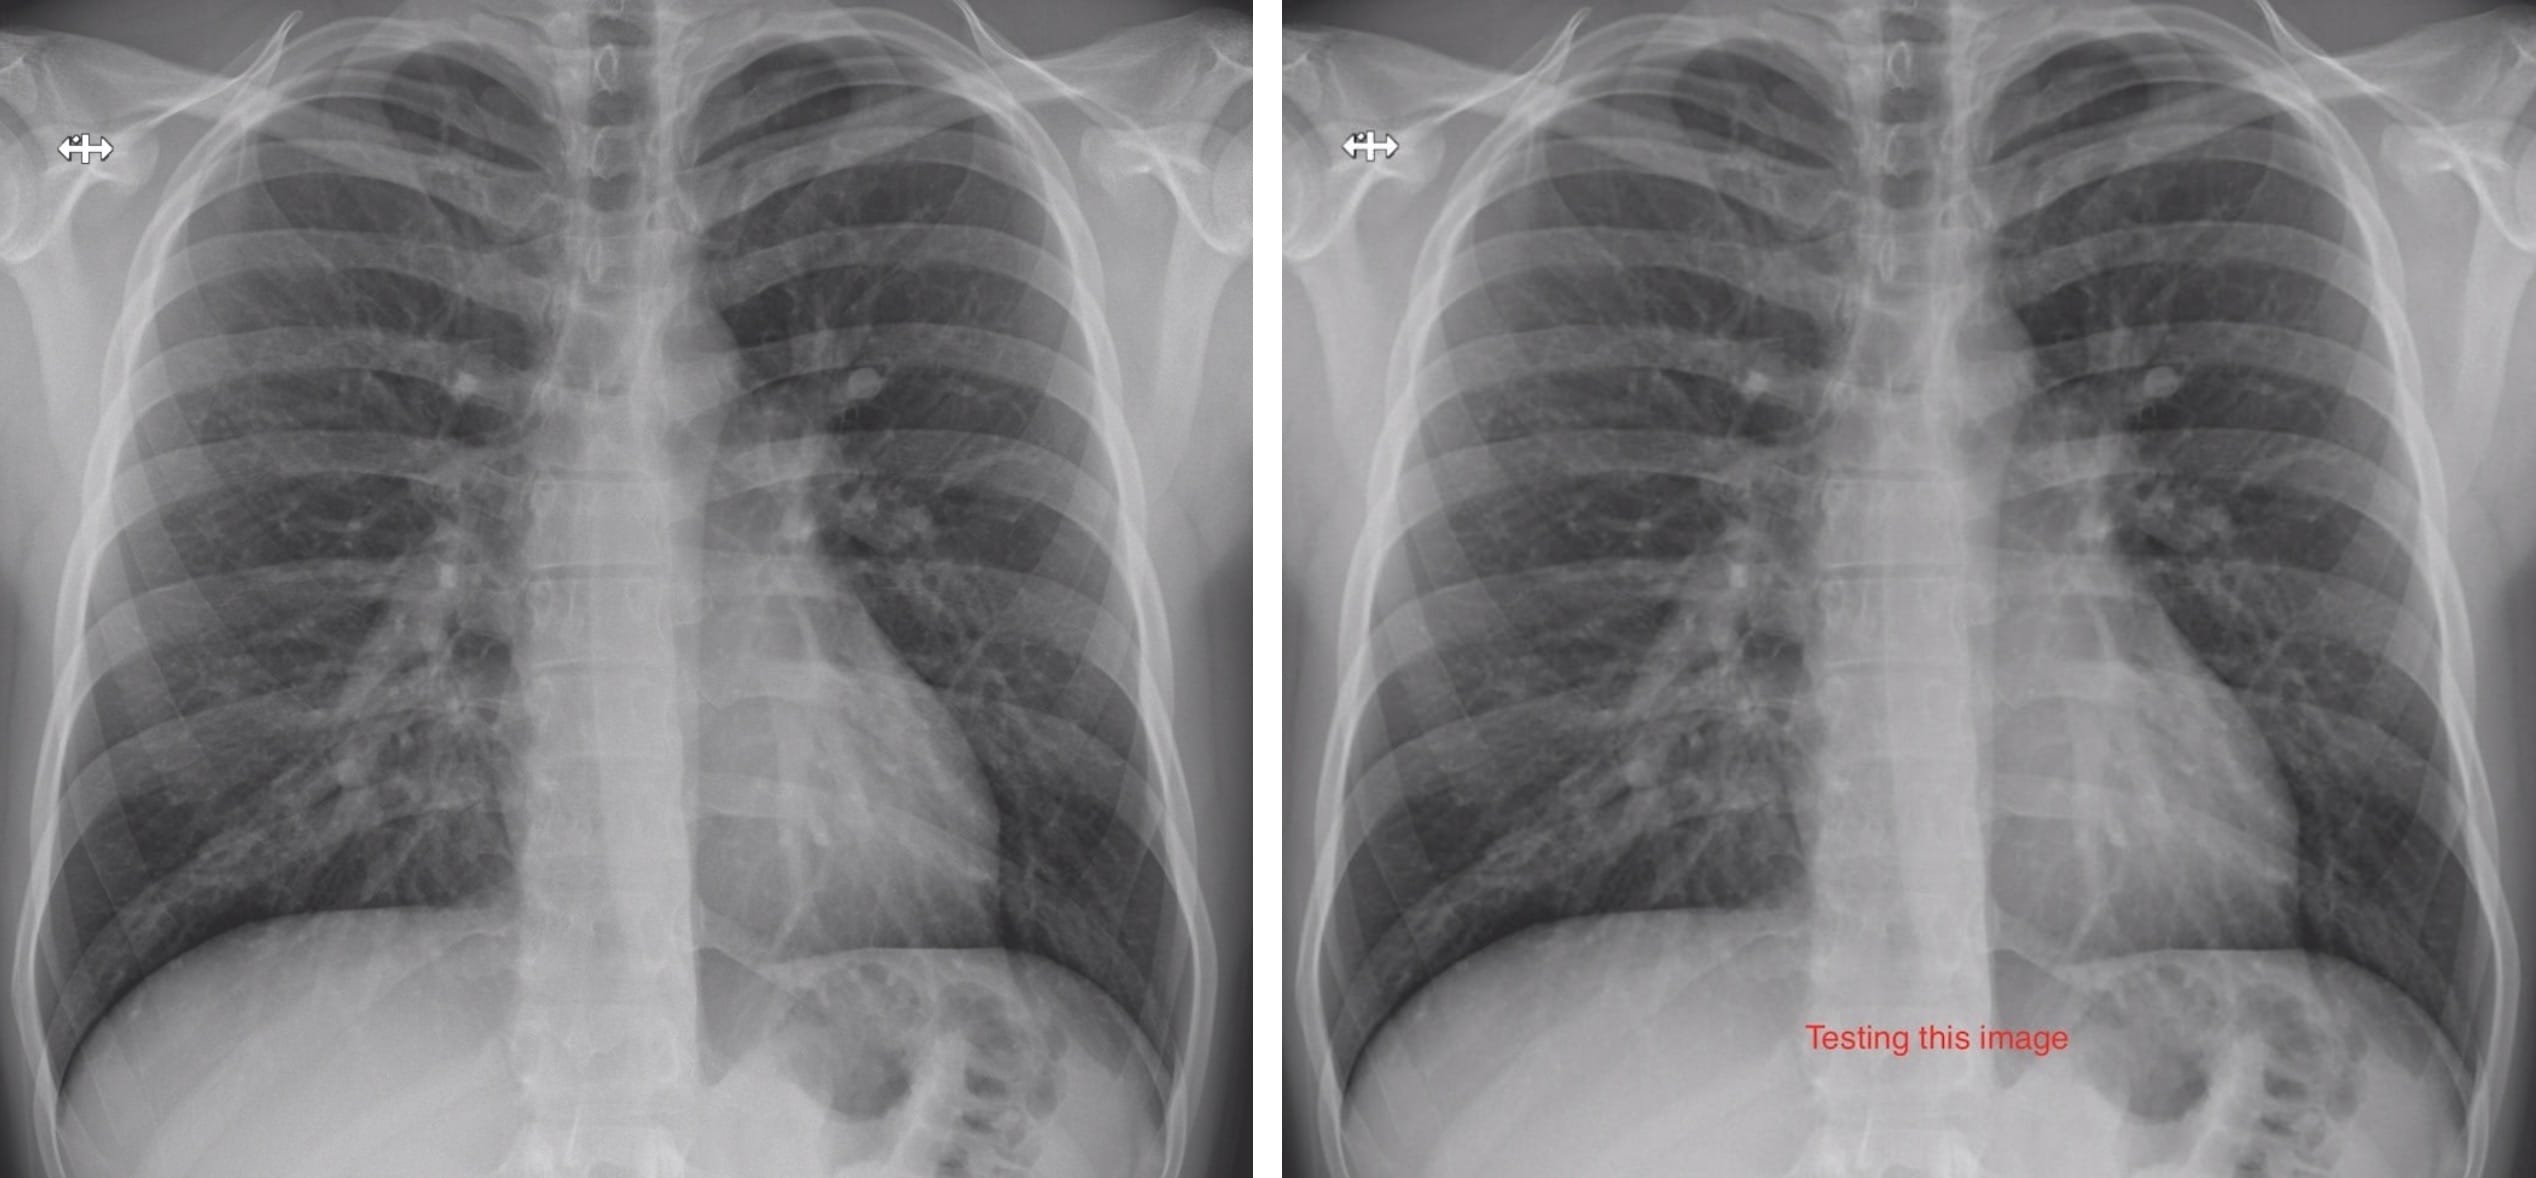
Two CXR images side-by-side (without lightbox function).
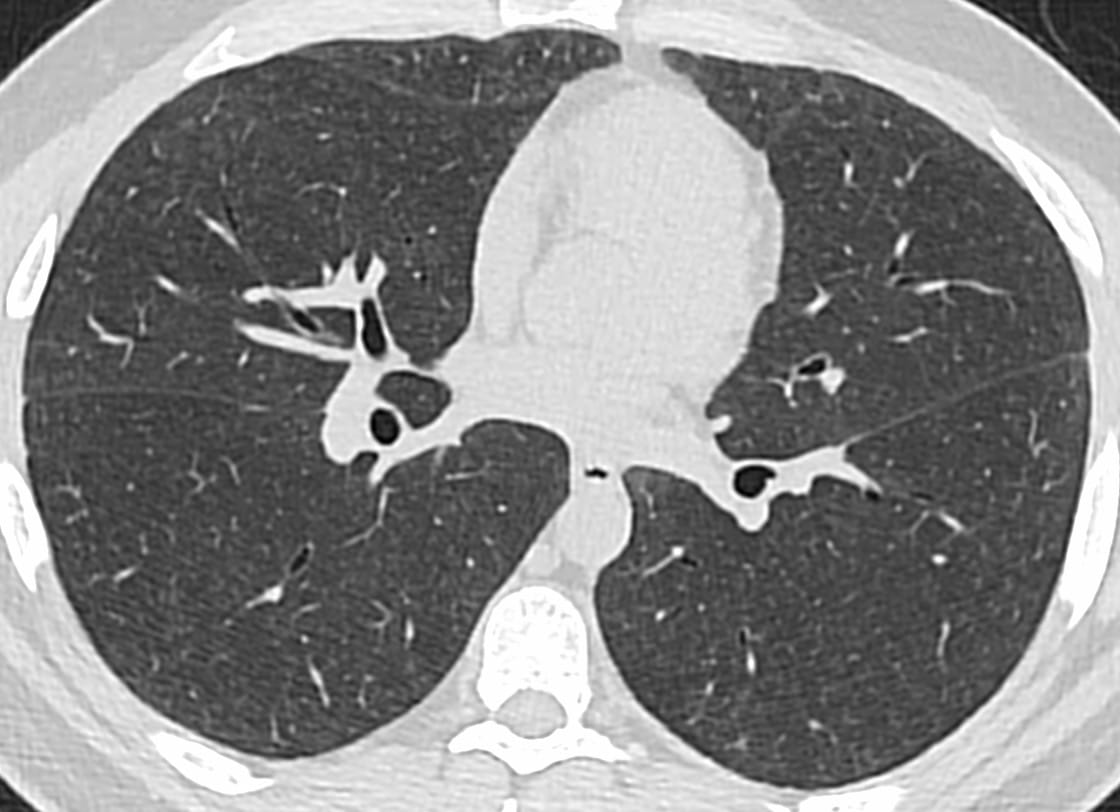
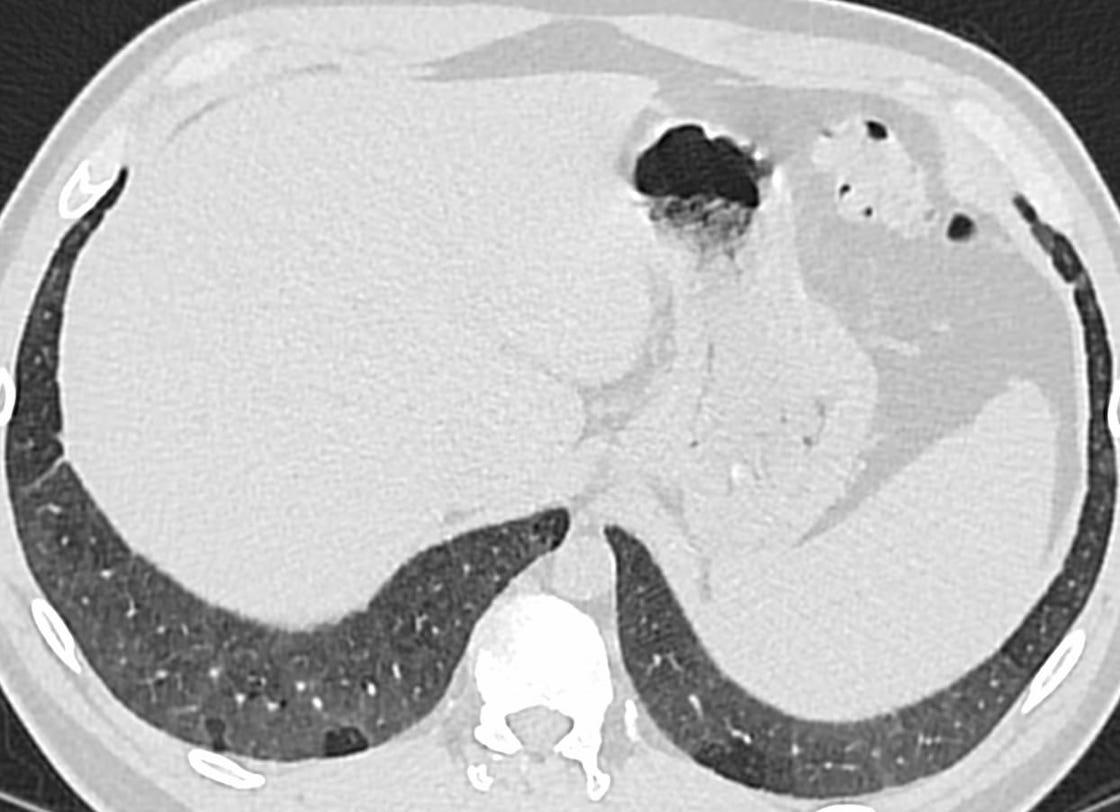
Three CXR images side-by-side (without lightbox function; must have same pixel dimensions).
An interesting aside here↩︎